Jellyfin – Monitoring with Telegraf, Grafana and InfluxDB 2.x
I’m using Grafana, InfluxDB 2.x (with Flux) and Telegraf to monitor my Docker environment. At first I used the Jellyfin metrics to monitor Jellyfin, but I was never really satisfied with this solution. But then I found a post which hinted me to use the Jellyfin API for querying the needed data. So I build a similar solution based on this post “https://sno.ws/jellyfin-stats“.
What to monitor
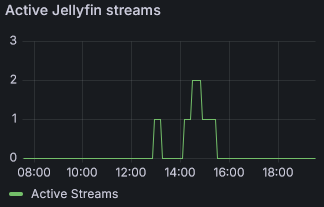
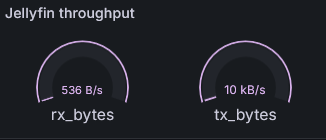
For me it’s just important to see how many simultaneous streams there are and the network traffic throughput. But with this solution, you could also see who streamed what. The Jellyfin Telegraf conf is responsible for the active streams and the Docker Telegraf conf allows us to display the Jellyfin network throughput.
Telegraf conf – Jellyfin
The following telegraf config file is querying the Session Id, UserName, DeviceName, Client, PlayState and the NowPlayingItem. That allows us to count active streams and also what users are streaming. The following config can either be appendet to the telegraf.conf file or in a separate file under telegraf.d/jellyfin.conf. Make sure, to replace <FQDN> and <Token> with the Jellyfin URL and an Jellyfin API token. The API Token can be created via the Jellyfin Webinterface -> Admin Dashboard -> API Keys.
[[inputs.http]]
  urls = [
    "https://<FQDN>/Sessions"
  ]

  headers = {"Authorization" = "MediaBrowser Token=<Token>", "Content-Type" = "application/json", "Accept" = "application/json"}
  method = "GET"

  data_format = "json_v2"

  [[inputs.http.json_v2]]
    measurement_name = "jellyfin"

    [[inputs.http.json_v2.object]]
      path = "@this"
      disable_prepend_keys = true
      included_keys = [
        "UserName",
        "DeviceName",
        "Client",
        "PlayState_IsPaused",
        "NowPlayingItem_Name",
        "NowPlayingItem_Path",
        "NowPlayingItem_SeriesName",
        "NowPlayingItem_IndexNumber",
        "NowPlayingItem_ParentIndexNumber"
      ]
      tags = ["Id"]
Restart the Telegraf container after adjusting the configuration file.
Telegraf conf – Docker
For displaying the Jellyfin network throughput, we can use the Docker Input plugin. Make sure that the following section in the telegraf.conf file is enabled (not commented out):
[[inputs.docker]]
...
  perdevice_include = ["cpu", "blkio", "network"]
...
  total_include = ["cpu", "blkio", "network"]
Restart the Telegraf container after adjusting the configuration file.
Grafana Visualization
To import this JSON data, create a new visualization in Grafana, navigate to “Query inspector”, JSON and paste the content in there and replace the datasource (influxdb) with your bucket.
Streams per User

To achieve this kind of Visualization, import the following JSON config:
{
  "id": 65124,
  "type": "state-timeline",
  "title": "Jellyfin streams",
  "gridPos": {
    "x": 18,
    "y": 15,
    "h": 6,
    "w": 6
  },
  "fieldConfig": {
    "defaults": {
      "custom": {
        "lineWidth": 0,
        "fillOpacity": 70,
        "spanNulls": false,
        "insertNulls": 300000,
        "hideFrom": {
          "tooltip": false,
          "viz": false,
          "legend": false
        }
      },
      "color": {
        "mode": "thresholds"
      },
      "mappings": [],
      "thresholds": {
        "mode": "absolute",
        "steps": [
          {
            "color": "#A352CC",
            "value": null
          }
        ]
      },
      "displayName": "${__field.labels.UserName}",
      "fieldMinMax": false
    },
    "overrides": []
  },
  "pluginVersion": "11.3.0",
  "targets": [
    {
      "datasource": {
        "type": "influxdb",
        "uid": "b1962428-9fd6-4517-8c24-45be5e165d2e"
      },
      "groupBy": [
        {
          "params": [
            "$__interval"
          ],
          "type": "time"
        },
        {
          "params": [
            "null"
          ],
          "type": "fill"
        }
      ],
      "orderByTime": "ASC",
      "policy": "default",
      "query": "from(bucket: \"telegraf\")\n  |> range(start: v.timeRangeStart, stop: v.timeRangeStop)\n  |> filter(fn: (r) => r[\"_measurement\"] == \"jellyfin\")\n  |> pivot(rowKey:[\"_time\"], columnKey: [\"_field\"], valueColumn: \"_value\")\n  |> filter(fn: (r) => r[\"IsPaused\"] == false)\n  |> group(columns: [\"UserName\"])\n  |> map(fn: (r) => ({\n      r with\n      display_value: if exists r.IndexNumber and exists r.ParentIndexNumber and exists r.Name and exists r.SeriesName then\n                      r.SeriesName + \" - S\" + string(v: r.ParentIndexNumber) + \"E\" + string(v: r.IndexNumber) + \" - \" + r.Name\n                      else r.Name\n  }))\n  |> filter(fn: (r) => exists r[\"display_value\"])\n  |> keep(columns: [\"display_value\", \"UserName\", \"_time\"])\n",
      "rawQuery": true,
      "refId": "A",
      "resultFormat": "time_series",
      "select": [
        [
          {
            "params": [
              "value"
            ],
            "type": "field"
          },
          {
            "params": [],
            "type": "mean"
          }
        ]
      ],
      "tags": []
    }
  ],
  "datasource": {
    "type": "influxdb",
    "uid": "b1962428-9fd6-4517-8c24-45be5e165d2e"
  },
  "options": {
    "mergeValues": true,
    "showValue": "auto",
    "alignValue": "left",
    "rowHeight": 0.9,
    "legend": {
      "showLegend": false,
      "displayMode": "list",
      "placement": "bottom"
    },
    "tooltip": {
      "mode": "single",
      "sort": "none",
      "maxHeight": 600
    }
  }
}
Active Streams

To achieve this kind of Visualization, import the following JSON config:
{
  "datasource": {
    "type": "influxdb",
    "uid": "b1962428-9fd6-4517-8c24-45be5e165d2e"
  },
  "fieldConfig": {
    "defaults": {
      "custom": {
        "drawStyle": "line",
        "lineInterpolation": "linear",
        "barAlignment": 0,
        "lineWidth": 1,
        "fillOpacity": 0,
        "gradientMode": "none",
        "spanNulls": false,
        "insertNulls": false,
        "showPoints": "auto",
        "pointSize": 5,
        "stacking": {
          "mode": "none",
          "group": "A"
        },
        "axisPlacement": "auto",
        "axisLabel": "",
        "axisColorMode": "text",
        "axisBorderShow": false,
        "scaleDistribution": {
          "type": "linear"
        },
        "axisCenteredZero": false,
        "hideFrom": {
          "tooltip": false,
          "viz": false,
          "legend": false
        },
        "thresholdsStyle": {
          "mode": "off"
        },
        "lineStyle": {
          "fill": "solid"
        }
      },
      "color": {
        "mode": "palette-classic"
      },
      "mappings": [],
      "thresholds": {
        "mode": "absolute",
        "steps": [
          {
            "color": "green",
            "value": null
          },
          {
            "color": "red",
            "value": 80
          }
        ]
      },
      "decimals": 0,
      "displayName": "Active Streams",
      "min": 0,
      "noValue": "0",
      "unit": "none"
    },
    "overrides": []
  },
  "gridPos": {
    "h": 6,
    "w": 6,
    "x": 12,
    "y": 15
  },
  "id": 65128,
  "options": {
    "tooltip": {
      "mode": "single",
      "sort": "none",
      "maxHeight": 600
    },
    "legend": {
      "showLegend": true,
      "displayMode": "list",
      "placement": "bottom",
      "calcs": []
    }
  },
  "pluginVersion": "9.5.2",
  "targets": [
    {
      "datasource": {
        "type": "influxdb",
        "uid": "b1962428-9fd6-4517-8c24-45be5e165d2e"
      },
      "groupBy": [
        {
          "params": [
            "$__interval"
          ],
          "type": "time"
        },
        {
          "params": [
            "null"
          ],
          "type": "fill"
        }
      ],
      "orderByTime": "ASC",
      "policy": "default",
      "query": "from(bucket: \"telegraf\")\n  |> range(start: v.timeRangeStart, stop: v.timeRangeStop)\n  |> filter(fn: (r) => r[\"_measurement\"] == \"jellyfin\")\n  |> filter(fn: (r) => r[\"_field\"] == \"IsPaused\" or r[\"_field\"] == \"Name\")\n  |> pivot(rowKey:[\"_time\"], columnKey: [\"_field\"], valueColumn: \"_value\")\n  |> filter(fn: (r) => r[\"IsPaused\"] == false and exists r[\"Name\"])\n  |> group(columns: [\"_time\"])\n  |> count(column: \"Id\")\n  |> group()\n  |> aggregateWindow(every: ${inter}, fn: last, createEmpty: true, column: \"Id\")\n  |> yield(name: \"sum\")",
      "rawQuery": true,
      "refId": "A",
      "resultFormat": "time_series",
      "select": [
        [
          {
            "params": [
              "value"
            ],
            "type": "field"
          },
          {
            "params": [],
            "type": "mean"
          }
        ]
      ],
      "tags": []
    }
  ],
  "title": "Active Jellyfin streams",
  "type": "timeseries"
}
Network Throughput

To achieve this kind of Visualization, import the following JSON config:
{
  "datasource": {
    "type": "influxdb",
    "uid": "b1962428-9fd6-4517-8c24-45be5e165d2e"
  },
  "fieldConfig": {
    "defaults": {
      "custom": {
        "drawStyle": "line",
        "lineInterpolation": "linear",
        "barAlignment": 0,
        "lineWidth": 1,
        "fillOpacity": 0,
        "gradientMode": "none",
        "spanNulls": false,
        "insertNulls": false,
        "showPoints": "auto",
        "pointSize": 5,
        "stacking": {
          "mode": "none",
          "group": "A"
        },
        "axisPlacement": "auto",
        "axisLabel": "",
        "axisColorMode": "text",
        "axisBorderShow": false,
        "scaleDistribution": {
          "type": "linear"
        },
        "axisCenteredZero": false,
        "hideFrom": {
          "tooltip": false,
          "viz": false,
          "legend": false
        },
        "thresholdsStyle": {
          "mode": "off"
        },
        "lineStyle": {
          "fill": "solid"
        }
      },
      "color": {
        "mode": "palette-classic"
      },
      "mappings": [],
      "thresholds": {
        "mode": "absolute",
        "steps": [
          {
            "color": "green",
            "value": null
          },
          {
            "color": "red",
            "value": 80
          }
        ]
      },
      "decimals": 0,
      "displayName": "Active Streams",
      "min": 0,
      "noValue": "0",
      "unit": "none"
    },
    "overrides": []
  },
  "gridPos": {
    "h": 6,
    "w": 6,
    "x": 12,
    "y": 15
  },
  "id": 65128,
  "options": {
    "tooltip": {
      "mode": "single",
      "sort": "none",
      "maxHeight": 600
    },
    "legend": {
      "showLegend": true,
      "displayMode": "list",
      "placement": "bottom",
      "calcs": []
    }
  },
  "pluginVersion": "9.5.2",
  "targets": [
    {
      "datasource": {
        "type": "influxdb",
        "uid": "b1962428-9fd6-4517-8c24-45be5e165d2e"
      },
      "groupBy": [
        {
          "params": [
            "$__interval"
          ],
          "type": "time"
        },
        {
          "params": [
            "null"
          ],
          "type": "fill"
        }
      ],
      "orderByTime": "ASC",
      "policy": "default",
      "query": "from(bucket: \"telegraf\")\n  |> range(start: v.timeRangeStart, stop: v.timeRangeStop)\n  |> filter(fn: (r) => r[\"_measurement\"] == \"jellyfin\")\n  |> filter(fn: (r) => r[\"_field\"] == \"IsPaused\" or r[\"_field\"] == \"Name\")\n  |> pivot(rowKey:[\"_time\"], columnKey: [\"_field\"], valueColumn: \"_value\")\n  |> filter(fn: (r) => r[\"IsPaused\"] == false and exists r[\"Name\"])\n  |> group(columns: [\"_time\"])\n  |> count(column: \"Id\")\n  |> group()\n  |> aggregateWindow(every: ${inter}, fn: last, createEmpty: true, column: \"Id\")\n  |> yield(name: \"sum\")",
      "rawQuery": true,
      "refId": "A",
      "resultFormat": "time_series",
      "select": [
        [
          {
            "params": [
              "value"
            ],
            "type": "field"
          },
          {
            "params": [],
            "type": "mean"
          }
        ]
      ],
      "tags": []
    }
  ],
  "title": "Active Jellyfin streams",
  "type": "timeseries"
}
GitHub – Source Files
Starting with this post, I’m going to upload the source files on my GitHub page: https://github.com/flo1t/selfhosted.
